Deep Dive Analysis: Why did this dll increase in file size by 50%?
We recently noticed that one of the dlls that we produce had suddenly jumped up in file size. The WinUI Controls library, Microsoft.UI.Xaml.Controls.dll that ships as part of Windows App SDK had ballooned in size in our internal builds. It had suddenly grown from 7 MB to 10.5 MB – approximately a 50% increase in size. What had happened to cause this? We needed to investigate the issue and fix it.
This post is a deep dive into the analysis that was done to figure out what caused this sudden increase in file size and how it could be fixed.
File size of a dll is important not just due to its impact on diskspace on a user’s machine but it also has an impact on the app at runtime due to the number of pages loaded into memory. We have internal automated processes to check the size of each dll that is built and to flag up instances where there is a substantial increase in size. That’s what brought this issue to our attention. We needed to investigate to figure out what caused the increase and how to fix it.
The first thing to do was to look over the commits that had gone into the branch within the relevant time period. None of the code changes that went in looked like they could have had such an impact. It is reasonable to expect new code and new features to increase the file size of the built binary, but the magnitude of the increase was not reasonable based on what had changed. The only change that stood out as a potential candidate was an update to the version number of the C++ compiler build tools that we use. We updated MSVC tools from 14.35 to 14.36. Since none of the other changes looked like they could have had such a big impact, this change looked like the most likely one to have introduced the file size increase.
I tried building the dll on my machine, switching between the two MSVC versions and was able to confirm that moving from 14.35 to 14.36 did in fact increase the file size by 50%. But how?
When investigating issues related to file size of a dll, a great tool to use is SizeBench (see blog post SizeBench: a new tool for analyzing Windows binary size). It is available to install from the Microsoft Store. This is a powerful tool that lets you open a dll along with its matching pdb symbols file and see a breakdown of how the space is being consumed by the different parts of your dll. One very useful feature is its ability to perform a diff of two different versions of a binary to see what has changed. If a particular class or function has suddenly gotten much bigger, it will show up in the diff.
We look at a diff of the Compilands (Obj files) and sort by file size diff.
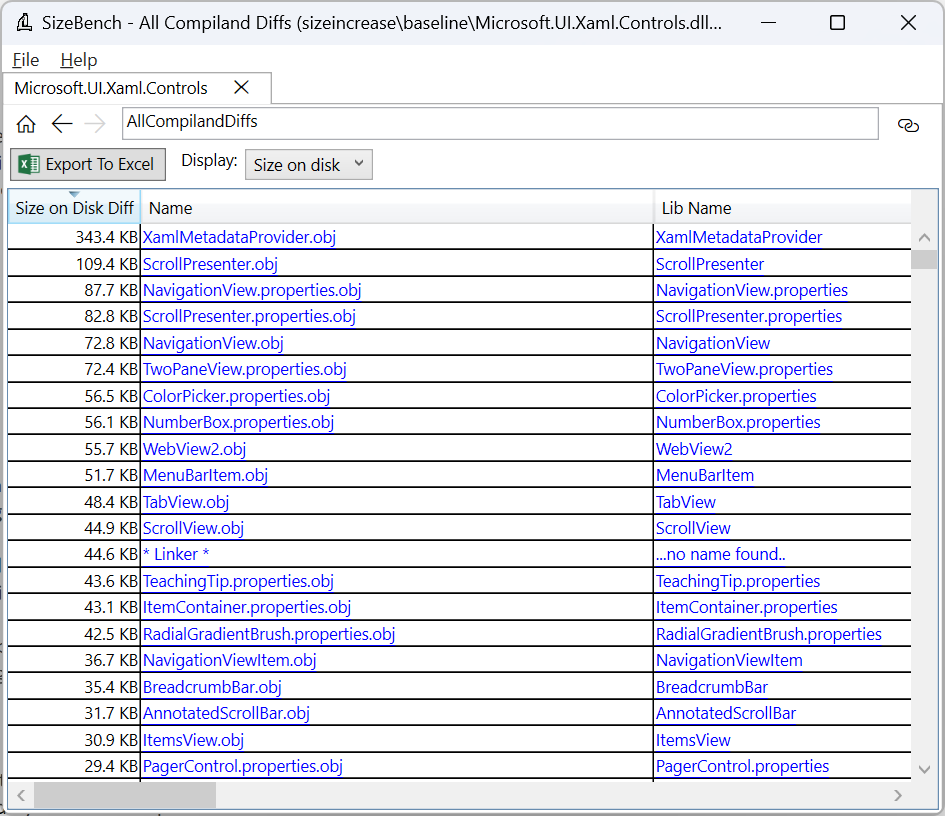
No one .obj jumps out as the source of the 3.5 MB file size increase – instead it seems like many of the compilands increased by a few dozen kilobytes. We drill in some more to one of the obj files to see if we can figure out what is going on.
Here we see a breakdown of the 87 KB increase in ScrollPresenter.properties:

The increase is primarily in the “Code” and “Read-only data” sections of the binary. In the bottom right portion of the window, we can see a long list of individual symbols in the compiland that increased in size. Drilling in some more we take a look at one of the functions. We look at the function with the beautiful name of winrt::impl::produce<winrt::impl::reference<enum winrt::Microsoft::UI::Xaml::Controls::ScrollingScrollMode>, winrt::Windows::Foundation::IPropertyValue>::GetUInt8Array
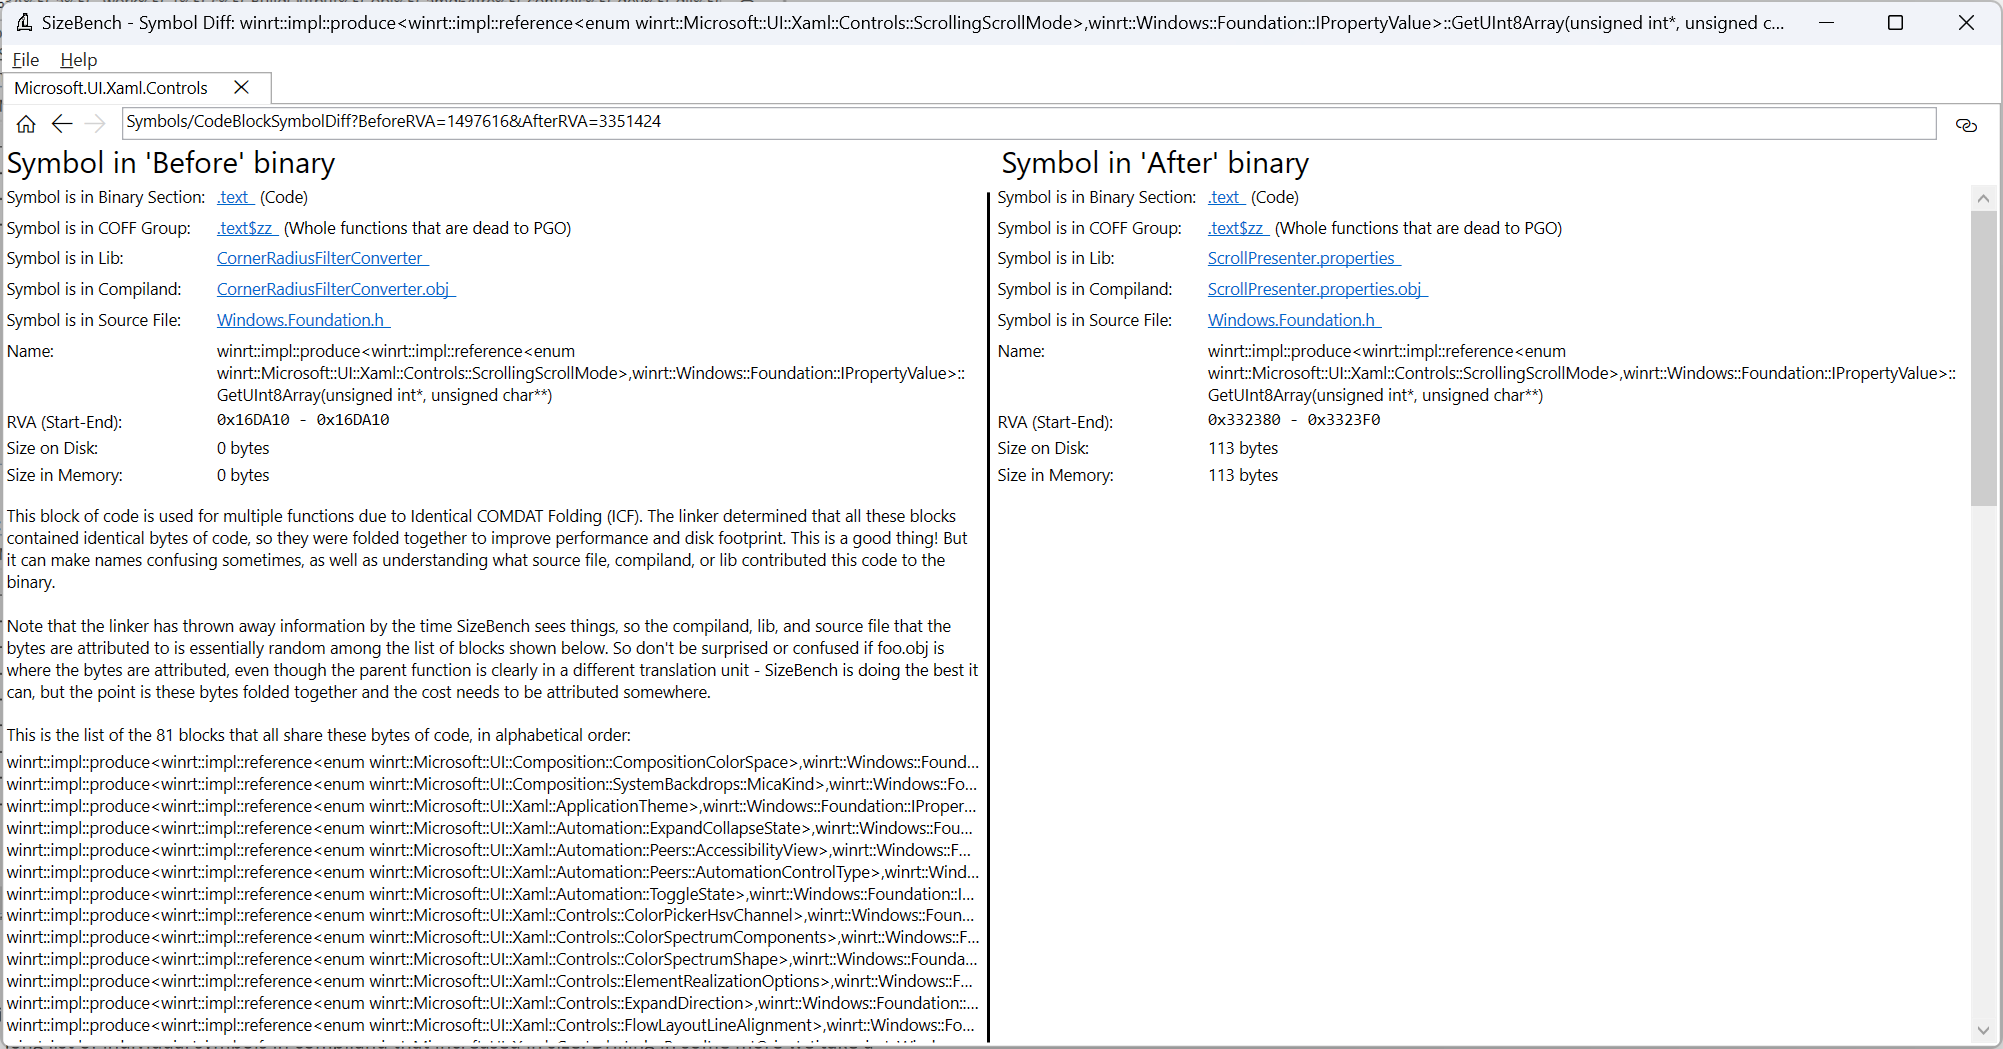
Now this is interesting. In the ‘After’ case, we have a unique function for this instantiation of the GetUInt8Array function template. But in the ‘Before’ case we can see that there are 81 instantiations that all got folded together in the final binary as a result of COMDAT folding. This is an optimization feature of the linker where it will fold together functions that compiled down to identical bytes of code so it only needs to have a single copy in the binary file. Looking around in SizeBench some more we can find many instances of the same pattern where functions are getting folded in the Before case but not in the After case. Even though each of these functions is small individually, there are hundreds of them each with many instances that are no longer being folded. Something happened to prevent these functions from getting folded. But what?
To dig in deeper, we use WinDbg. This debugging tool has somewhat of a steep learning curve, but it is very powerful. In addition to debugging a running application or examining a memory dump, you can also directly open a dll to examine it. Counter-intuitively, you do this through choosing the ‘Open dump file’ menu and selecting the dll file. You also need to make sure that the tool can find and load the matching pdb file.
We launch two instances of WinDbg and open the Before dll and the After dll side by side. We use the ‘x’ (x (Examine Symbols)) command to search for symbols matching a pattern like the functions we saw in SizeBench previously:
x /D /a Microsoft_UI_Xaml_Controls!winrt::impl::produce*::GetUInt8Array
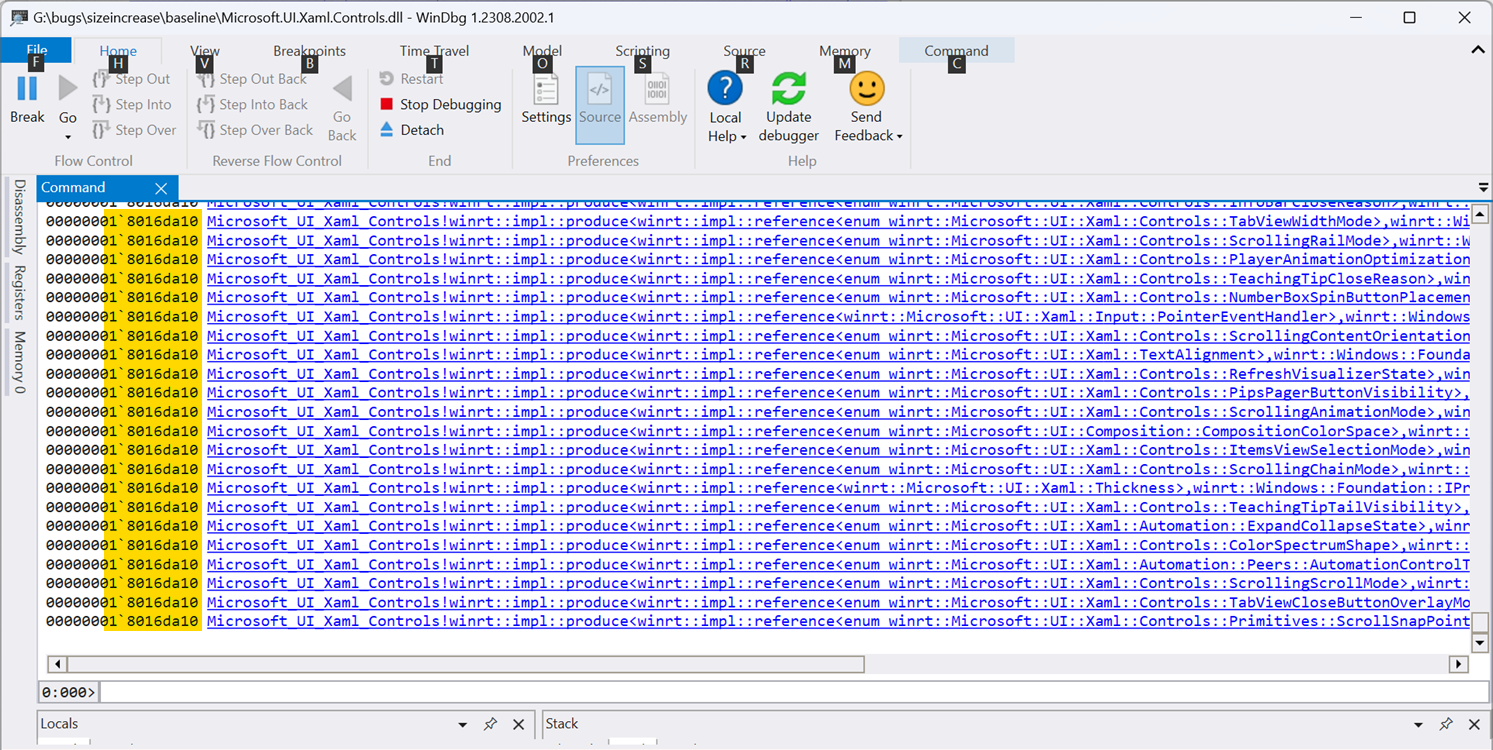
We compare the results for Before and After.
Before:
After:
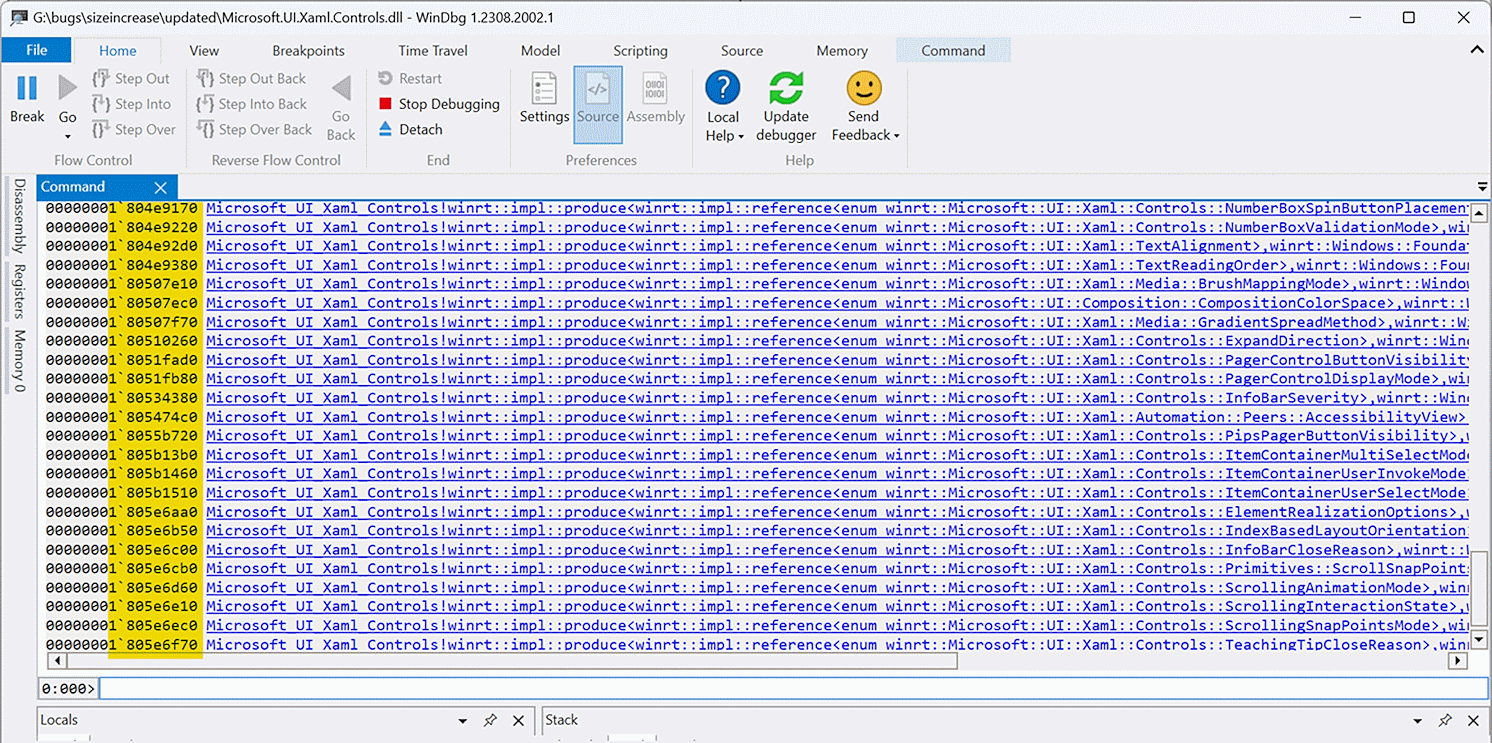
As expected, in the Before case each of these functions share the same address, but in the After case each has a unique address (see the highlighted column on the left in the screenshots).
Let’s compare two of these unique functions in the After case to see what is different. We use the ‘uf’ command (uf (Unassemble Function)) to disassemble the functions:
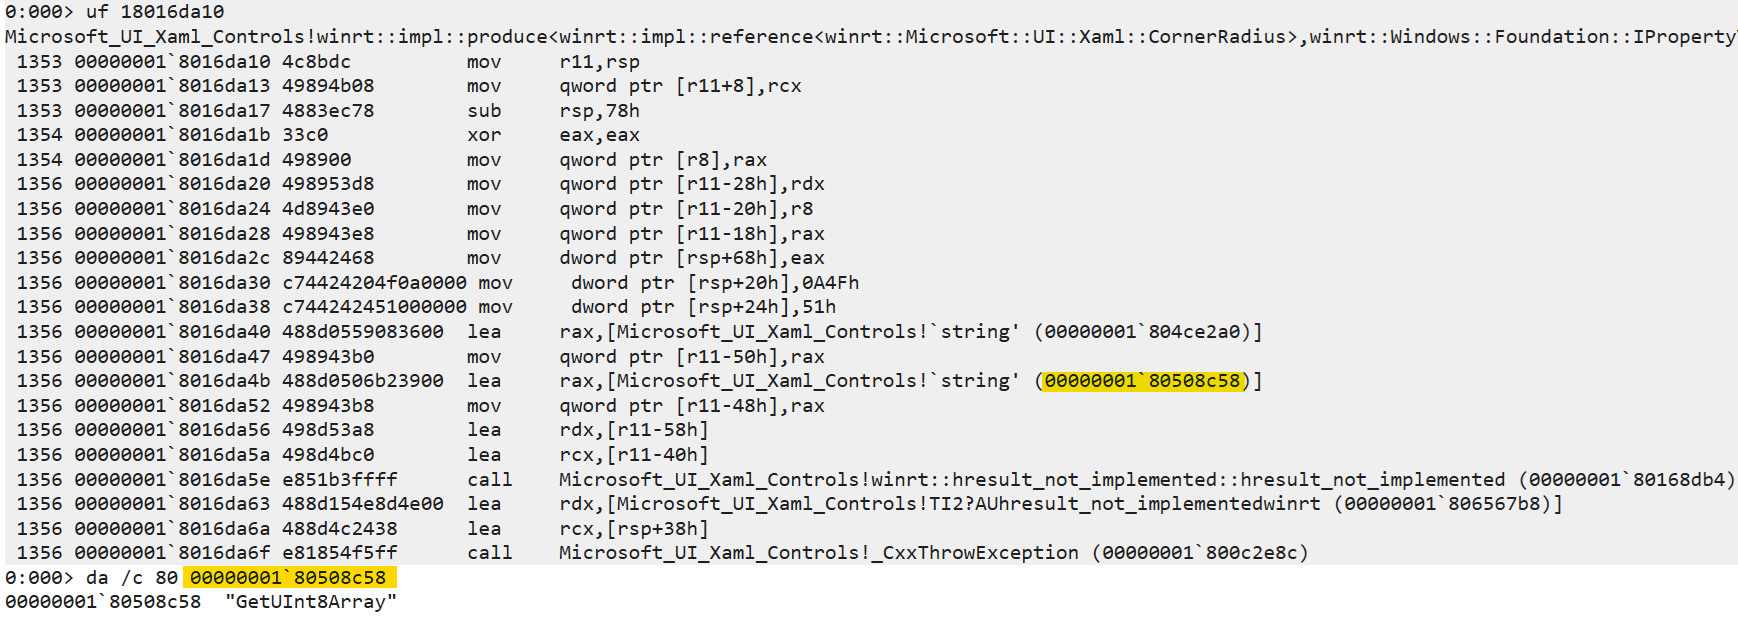
It’s not immediately obvious at first glance, but we can see that these two functions are identical, except the address passed to the second lea instruction is different across the two cases (highlighted). Let’s examine those addresses. We use the ‘da’ command to dump out the content at the address as a string.
So, we are loading a string that contains the full name of the function. Since these are obviously different across the two functions it makes sense that they cannot be COMDAT folded. What did this look like in the Before case?
Ah ha! So, in the Before case the second string loaded is just the simple name of the function (“GetUInt8Array”). But in the After case, it is the fully qualified name of the function including the template arguments.
So, we have partially explained what caused the file size increase. But what introduced this change? We examine the source for this function. We can see the path and line number in WinDbg. This code is generated by a tool C++/WinRT which makes heavy use of C++ templates.
int32_t __stdcall GetUInt8Array(uint32_t* __valueSize, uint8_t** value) noexcept final try
{
    clear_abi(value);
    typename D::abi_guard guard(this->shim());
    this->shim().GetUInt8Array(detach_abi<uint8_t>(__valueSize, value));
    return 0;
}
catch (...) { return to_hresult(); }
On its own this isn’t too enlightening, but from the disassembly listed above, we can tell that a winrt::hresult_not_implemented is being created and thrown. Let’s look at that:
struct hresult_not_implemented : hresult_error
{
   hresult_not_implemented(WINRT_IMPL_SOURCE_LOCATION_ARGS_SINGLE_PARAM) noexcept :
   hresult_error(impl::error_not_implemented WINRT_IMPL_SOURCE_LOCATION_FORWARD) {}
   hresult_not_implemented(param::hstring const& message WINRT_IMPL_SOURCE_LOCATION_ARGS) noexcept :
   hresult_error(impl::error_not_implemented, message WINRT_IMPL_SOURCE_LOCATION_FORWARD) {}
   hresult_not_implemented(take_ownership_from_abi_t WINRT_IMPL_SOURCE_LOCATION_ARGS) noexcept :
   hresult_error(impl::error_not_implemented, take_ownership_from_abi WINRT_IMPL_SOURCE_LOCATION_FORWARD) {}
};
(from base_error.h#L356)
The WINRT_IMPL_SOURCE_LOCATION_ARGS_SINGLE_PARAM macro seems relevant. We search for that:
#define WINRT_IMPL_SOURCE_LOCATION_ARGS_SINGLE_PARAM std::source_location const& sourceInformation = std::source_location::current()(from base_macros.h#L90)
And seeing where this is used:
winrt_throw_hresult_handler(sourceInformation.line(), sourceInformation.file_name(), sourceInformation.function_name(), WINRT_IMPL_RETURNADDRESS(), code);(from base_error.h#L309)
The call to function_name() looks like what we are looking for. A quick experiment in a test app confirms that std::source_location::function_name returns the simple function name in MSVC 14.35, but the fully qualified name including namespace and template arguments in MSVC 14.36. It turns out that this was a recent update in the MSVC standard library to enable this new functionality.
So now we know what changed and how that caused the file size of our dll to increase so much. So, what can we do to fix it?
Luckily C++/WinRT includes a feature that allows us to turn off the use of std::source_location:
So, we update our code to define WINRT_NO_SOURCE_LOCATION and rebuild. Sure enough, we see the file size drop back down to where it was before. Success!
After completing our analysis using SizeBench and WinDbg we were able to get to the bottom of the mystery of why our dll had suddenly jumped in size by 50% and to find the right fix to bring the size back down to the previous level.


 Light
Light Dark
Dark
8 comments
Tried to use SizeBench to analyze a NetStandard2-Assembly compiled with VS2022 with portable PDB-file (Extracted from the NLog-nuget-package).
SizeBench exploded with the following error, when trying to Examine Binary:
Google was not able to help. And Microsoft Bing ChatGPT also failed, which was most surprising.
But awesome diagnostic work. C++ template explosion is never fun. And suddenly getting shot in the foot, by a feature that should make your life easier is a little funny.
After reading the manual:
Maybe this tool will help investigate bloat in .NET application size:
– https://github.com/MichalStrehovsky/sizoscope
Yes, SizeBench is for native dlls only and does not support .net dlls. But it would be nice if SizeBench provided a clearer error message in this case. I’ll pass along the feedback to the author of SizeBench.
Nice writeup.
With C++/WinRT now in mainteance, I wonder how stuff like this will be improved in the future, and more relevant, what options are left for C++ developers on Microsoft world for GUI development.
There is a feature proposal in C++/WinRT to make the impact of the source location feature have less of an impact on file size: Feature request: Slim source location without function name #1337.
Even though active development of new features in C++/WinRT has slowed it is still a supported technology and it is still a good choice to use – it has not been deprecated or anything like that. Plenty of teams within Microsoft are still actively developing new code on C++/WinRT. For example the WinUI team (which I am on) continues to build new UI controls and features using C++/WinRT.
Microsoft employees also keep using ATL, and it isn’t because the tooling it something to praise about.
C++/WinRT being in maintenance means C++ developers will never have on Microsoft stack the same development experience as in Qt/QtCreator and C++ Builder, which was taken away from us with C++/CX deprecation.
So editing IDL files, without any kind of syntax highlighting and code completion, manually merging generated C++ code, with a framework stuck in C++17 is not going to change.
There is a dedicated escape hatch for the detailed function name:
This sounds like a more appropriate solution than WINRT_NO_SOURCE_LOCATION, as it lets you still pass line and file information to WIL.
A great ‘deep dive’ — From an person that is ‘just curious’ and knows nothing about these matters.
Made for an interesting read. Great analysis.